Dashboard
- Tim Hoefnagel
- Pim Reijnen
Dashboard
The Squeezely Dashboard helps you to keep track of your data in one place. Access your Squeezely Dashboard to get started.
Sales & Traffic
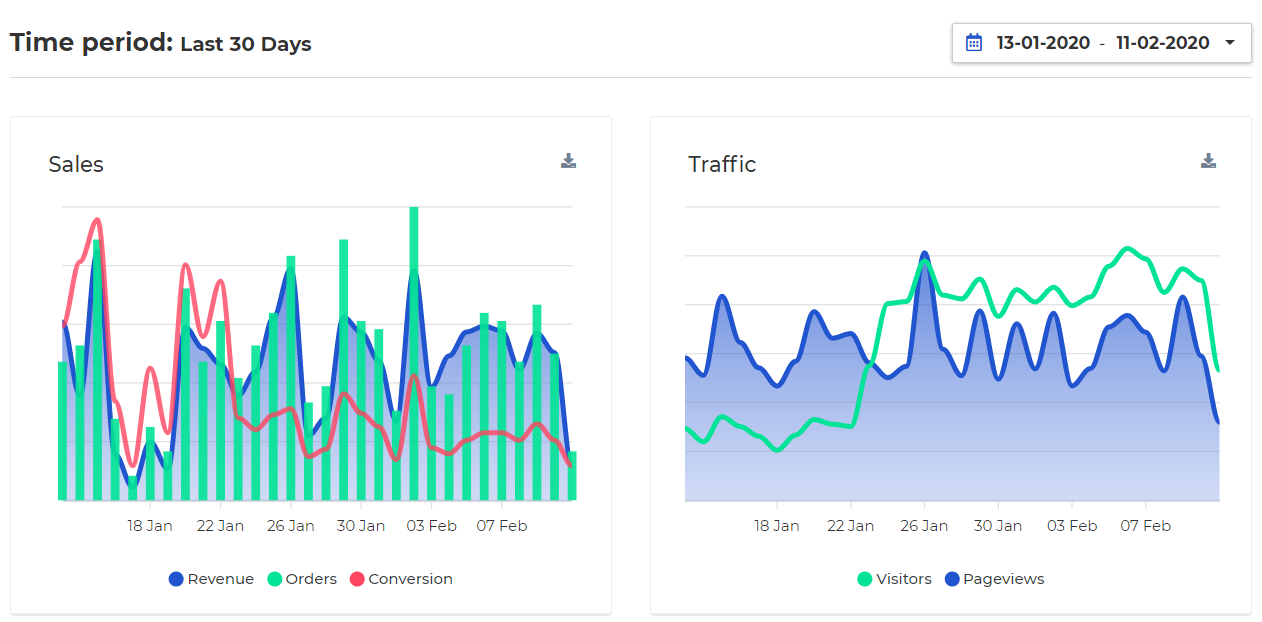
On top of your dashboard you will find graphs that tell you about your website sales and traffic. The graph will show information for the period that you have selected in the dropdown box for time period. When you hover your mouse over the graph it will show you metrics for seperate days.
The metrics explained:
- Revenue: The value of all combined orders on a day.
- Orders:The total amount of orders for a particular day.
- Conversion -The percentage of visitors that made an order in your store.
- Visitors: The amount of unique visitors to your website.
- Pageviews: The amount of pageviews on your website.
Website KPI's
Website KPI's are the cumulative and average numbers for your Key Performance Indicators (KPI's) during your selected timeframe. They include a small indicator to compare them to the previous time period.

Event statistics
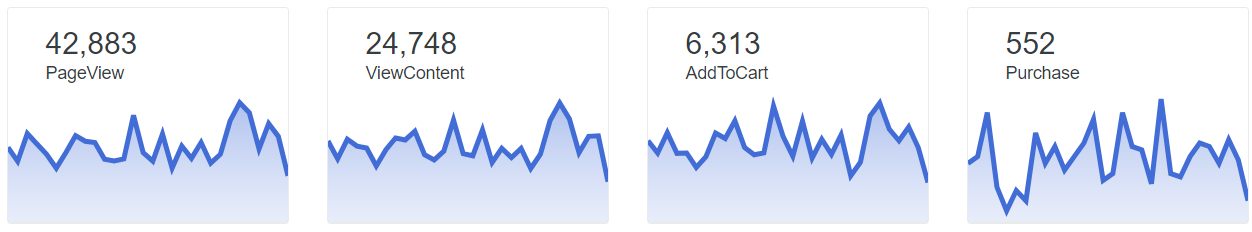
Under KPI's you will find smaller graphs that give you insight into the most important website events. The metrics explained:
- Pageview - Every page on your website includes a pageview event. This gives you insight in the total pages people have viewed on your site
- ViewContent - The ViewContent event keeps track of product views. This gives insights into the amount of product interactions that occurred on your site.
- AddToCart - The amount of times people add a product to their basket is collected via the AddToCart event. This shows how many products were added to a shopping cart.
- Purchase - The amount of unique purchases that were made during your selected timeframe
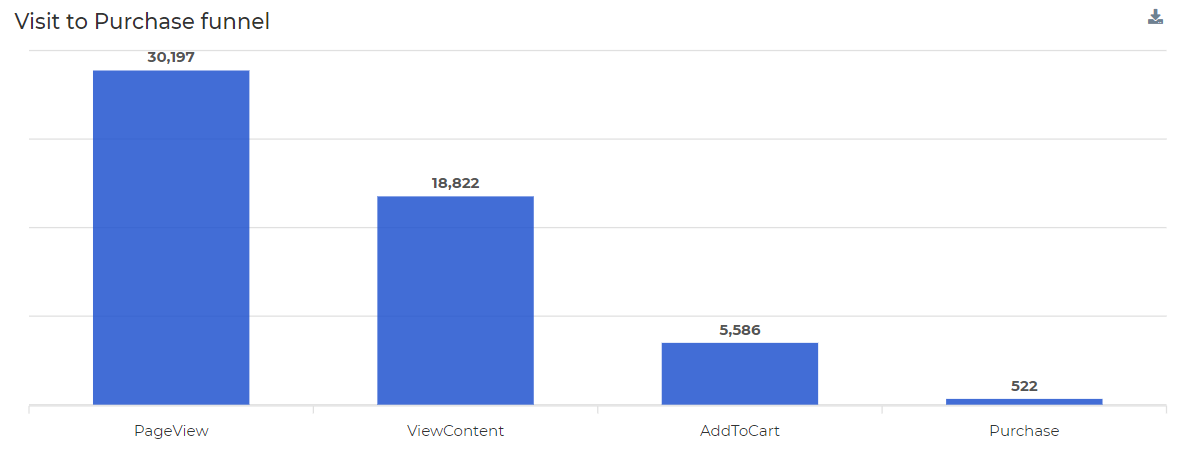
Visit to Purchase funnel
The visit to purchase funnel shows you the amount of unique people that performed below events. This creates a funnel that gives insight into the biggest drop off points in your store.
Advertising Statistics
If your Facebook and Google Ads accounts have been linked to Squeezely, you will find aggregated statistics for your advertising accounts right on your dashboard. Keep track of how much your spend was in certain periods of time and instantly see how that has impacted your website performance.

Search
Navigate
Want to find info about a specific feature? Check out these topics below!