| Tip |
|---|
| Welcome to the Squeezely Public Knowledgebase. Here is where you will find everything you need to know about using the Squeezely Platform. |
EventsDashboard
The Squeezely Dashboard helps you to keep track of your data in one place. Access your Squeezely Dashboard to get started.
Dashboard Components
Within the dashboard you will find the following components:
- Website Statistics Graph - This graph displays how your most important metrics progress over time.
- Website KPI Bar - This Bar shows Key Performance Indicators for your business.
- Campaign Statistics Overview - This overview shows the performance of your campaigns.
- Date Selector - This is where you select the period, for which the dashboard is generated.

Types of Statistics
There are two types of statistics that can be analyzed in the Campaign Dashboard:
- Custom Tracking Statistics - These statistics have been gathered within your website using the Squeezely Tracking Pixel and Squeezely Events.
- External Statistics - These statistics have been gathered by external marketing platforms you have connected to your Squeezely Account and are imported into the campaign dashboard.
Website Statistics Graph
On top of the Campaign Dashboard you will find a statistics graph. This graph will show you how different metrics progress over time. The metrics that are available depend on selections you make in the selection bar or in the Campaign Statistics Overview at the bottom of the page. There are four levels of filters that can be applied to selections in the website statistics graph:
- Statistics Type - Custom Tracking or External Statistics.
- Campaign Group - If you have created Campaigns Groups, these can be selected here. More information on Campaign Groups will follow at the bottom of this page.
- Traffic Source - The source(s) that generated your traffic.
- Campaign Source - The campaign(s) that generated your traffic.
Below we will explain both tracking types and the way these filters are applied for each tracking type.
Custom Tracking Statistics
First let's have a look at the available statistics when you select 'Custom Tracking' as your statistics type. Custom statistics will show up if you have setup Squeezely tracking. All statistics you will find here are generated by the platform based on information you have sent to Squeezely.
Visitors & Customers
For custom tracking, your data about your website visitors and customers can be displayed here.
Unique visitors - The total amount of unique visitors that have been to your website on a certain day.New Customers - The amount of website visitors that made a purchase for the first time ever are displayed as your 'New Customers'.
Returning Customers - The amount of website visitors that made a purchase, but have also made a purchase before are displayed as your 'Returning Customers'.

Purchases & Revenue
Also Squeezely reports about purchases and the purchase values that have been send to the Squeezely Platform.
Purchases - The total amount of purchases that have tracked by Squeezely on a particular day.
Revenue - The total amount of revenue generated by the purchases tracked by Squeezely on a particular day.

External Statistics
If you have connected external marketing platforms to the Squeezely Platform, this is where we will gather statistics about your external campaigns.What you find here has been reported to us by external platform and is generated based upon their measurement technologies and standards.
Campaign Statistics
Amount Spent - The amount of money spent to run campaigns on external marketing platforms, as reported to us on a particular day.
Impressions - The amount of impressions generated by campaigns on external marketing platforms, as reported to us on a particular day.
Link Clicks - The amount of link clicks generated by campaigns on external marketing platforms, as reported to us on a particular day.

Purchases & Revenue
This is where you can find all purchases and their value that have been tracked by your External Marketing Platforms.
Purchases - The total amount of purchases that have been reported by your external marketing platforms on a particular day.
Revenue - The total amount of revenue generated by the purchases that have been reported by your external marketing platforms on a particular day.

Website KPI Bar
The KPI Bar displays important overall statistics for your selected combination of source and campaigns, within your selected date range. Definitions for each metric are explained below the image.
Unique Visitors - The total amount of unique website visitors that were tracked.
Unique Customers - The total amount of unique website visitors that made a purchase.
Revenue - The total amount of revenue for the purchases made by the unique customers.
Uplift % - The difference between customer value of the users exposed to your campaigns, as compared to those in your control group. Only available if you are using a control group.

Campaign Statistics Overview
In the Campaign Statistics overview you can track results per campaign, which are displayed for your date selection. There are 3 levels of results you can analyze:
1- Group Level
This level of statistics shows you the total amount for a group of website visitors. The groups that are displayed at this level are:
All Traffic - Statistics for all website visitors, regardless of campaign and source statistics. This is only available for Custom Tracking Statistics.
All Campaigns - Statistics for all of your campaigns grouped together.
Campaign Groups - Statistics for a multiple campaigns that you have grouped into a campaign group. For example: "All Acquisition Campaigns".
2- Source Level
When you click on a group, it will fold open to source level. Here results from your group will be displayed for each tracked source. For example this could be 'Facebook' or 'Google'. Source is determined by the platform that has reported the results to us. For example, source Google will show results reported to Squeezely for campaigns linked to your group.
3- Campaign Level
You can click on the sources within your group, to fold open the campaign level. This will show you all individual campaigns, within the selection of your group and source. Campaign is determined by the platform that has reported the results to us. Each campaign will show results reported to Squeezely by its external source.

Using Campaign Groups
Campaign Groups help you to keep your dashboard organized. Essentially this groups multiple campaigns, so they can be analyzed as a group. Also these groups can be unfolded, to analyze specific sources or individual campaigns. To create a campaign group, press the button 'New Campaign Group' within your Dashboard.
Campaigns from external platforms can be grouped into Squeezely Campaign Groups. You will notice a field for each connected external platform. This will enable you to select from the campaigns in your external account. Once you have made your selections, press 'save' and you are done.

About Attribution
An important aspect of any report is the definitions used for attribution of results.
All reports that are collected by Squeezely use a default attribution window of 28 days post Click and 1 Day Post View. This means that statistics are attributed to your campaigns 28 days after a person has clicked an ad from your campaign and 1 day after an ad has been viewed.Sales & Traffic
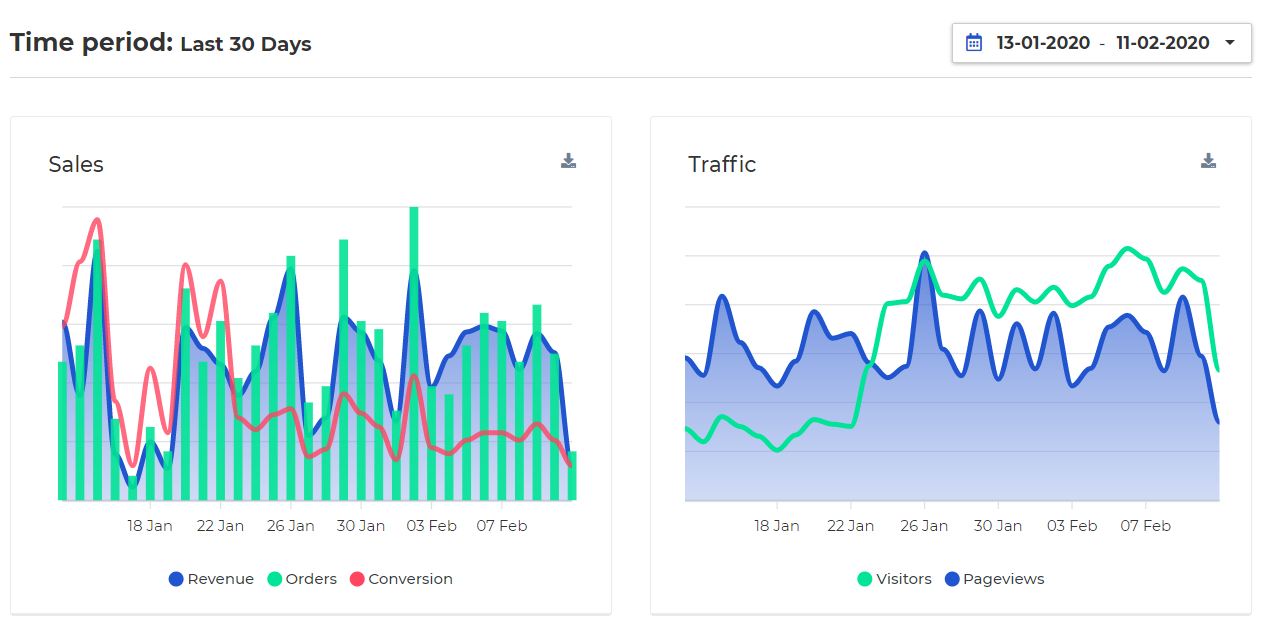
On top of your dashboard you will find graphs that tell you about your website sales and traffic. The graph will show information for the period that you have selected in the dropdown box for time period. When you hover your mouse over the graph it will show you metrics for seperate days.
The metrics explained:
- Revenue: The value of all combined orders on a day.
- Orders:The total amount of orders for a particular day.
- Conversion -The percentage of visitors that made an order in your store.
- Visitors: The amount of unique visitors to your website.
- Pageviews: The amount of pageviews on your website.
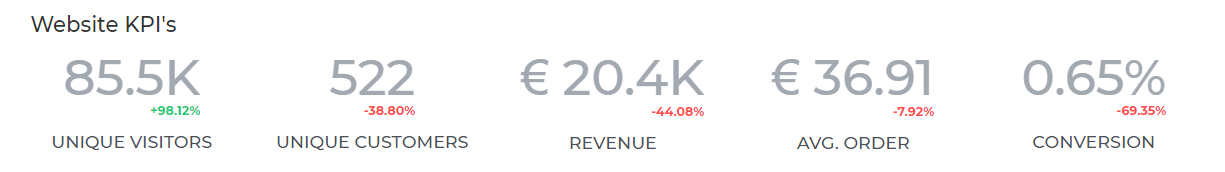
Website KPI's
Website KPI's are the cumulative and average numbers for your Key Performance Indicators (KPI's) during your selected timeframe. They include a small indicator to compare them to the previous time period.
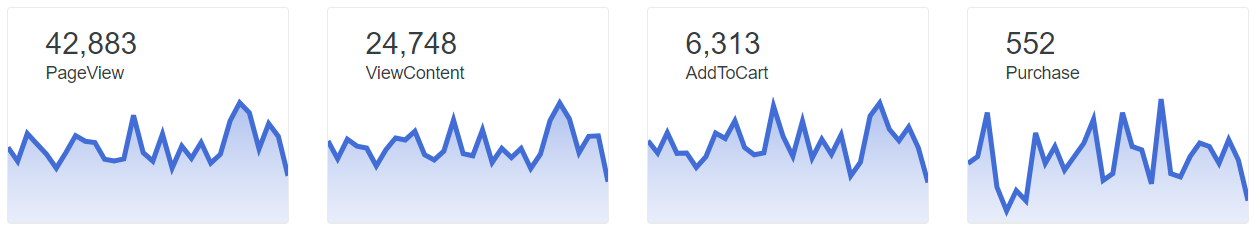
Event statistics
Under KPI's you will find smaller graphs that give you insight into the most important website events. The metrics explained:
- Pageview - Every page on your website includes a pageview event. This gives you insight in the total pages people have viewed on your site
- ViewContent - The ViewContent event keeps track of product views. This gives insights into the amount of product interactions that occurred on your site.
- AddToCart - The amount of times people add a product to their basket is collected via the AddToCart event. This shows how many products were added to a shopping cart.
- Purchase - The amount of unique purchases that were made during your selected timeframe
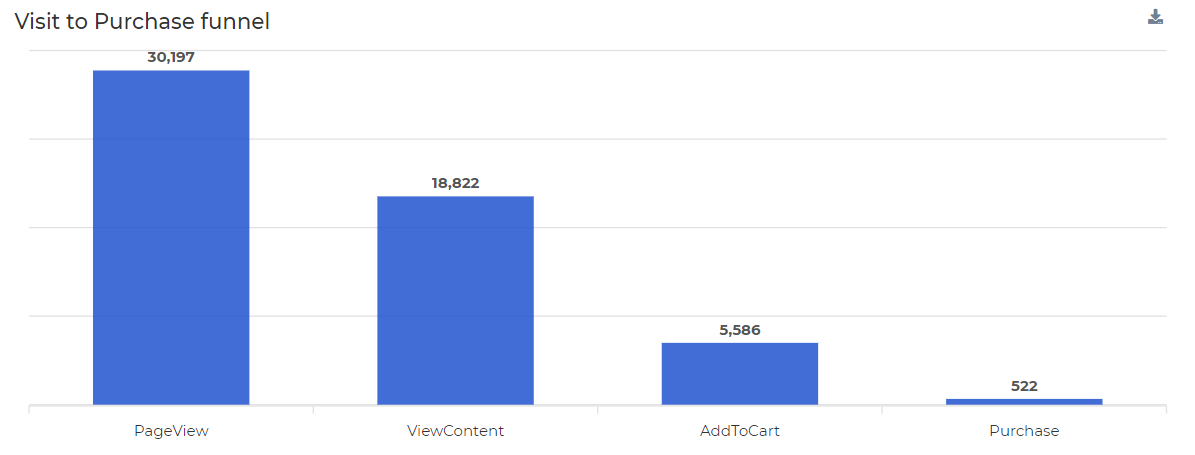
Visit to Purchase funnel
The visit to purchase funnel shows you the amount of unique people that performed below events. This creates a funnel that gives insight into the biggest drop off points in your store.
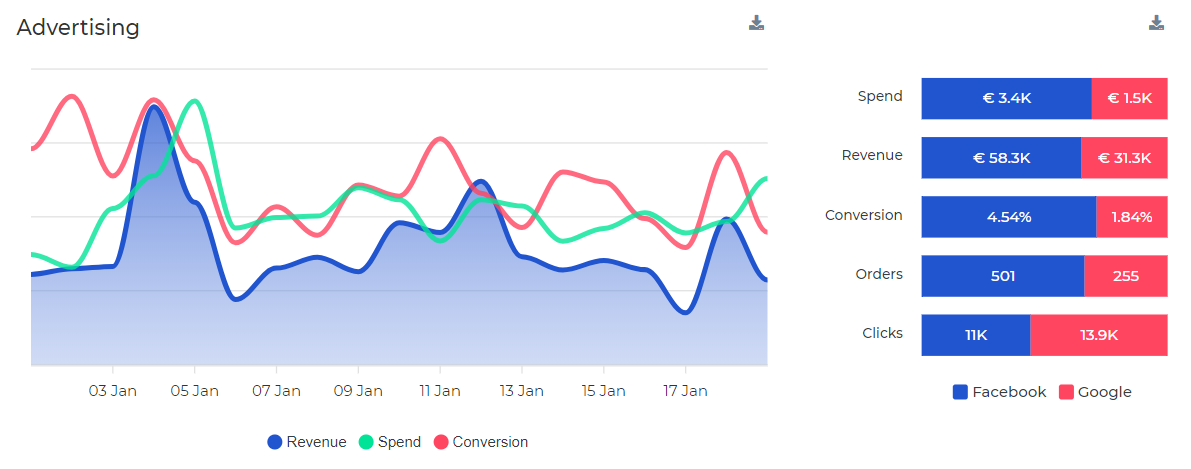
Advertising Statistics
If your Facebook and Google Ads accounts have been linked to Squeezely, you will find aggregated statistics for your advertising accounts right on your dashboard. Keep track of how much your spend was in certain periods of time and instantly see how that has impacted your website performance.
Search
| Live Search |
|---|
Navigate
Want to find info about a specific feature? Check out these topics below!
| Rw pagetree macro | ||
|---|---|---|
|